Zig Zag
The main purpose of the standard ZigZag Pivots is to analyse historical data in order to observe cycle's in a market's movement.
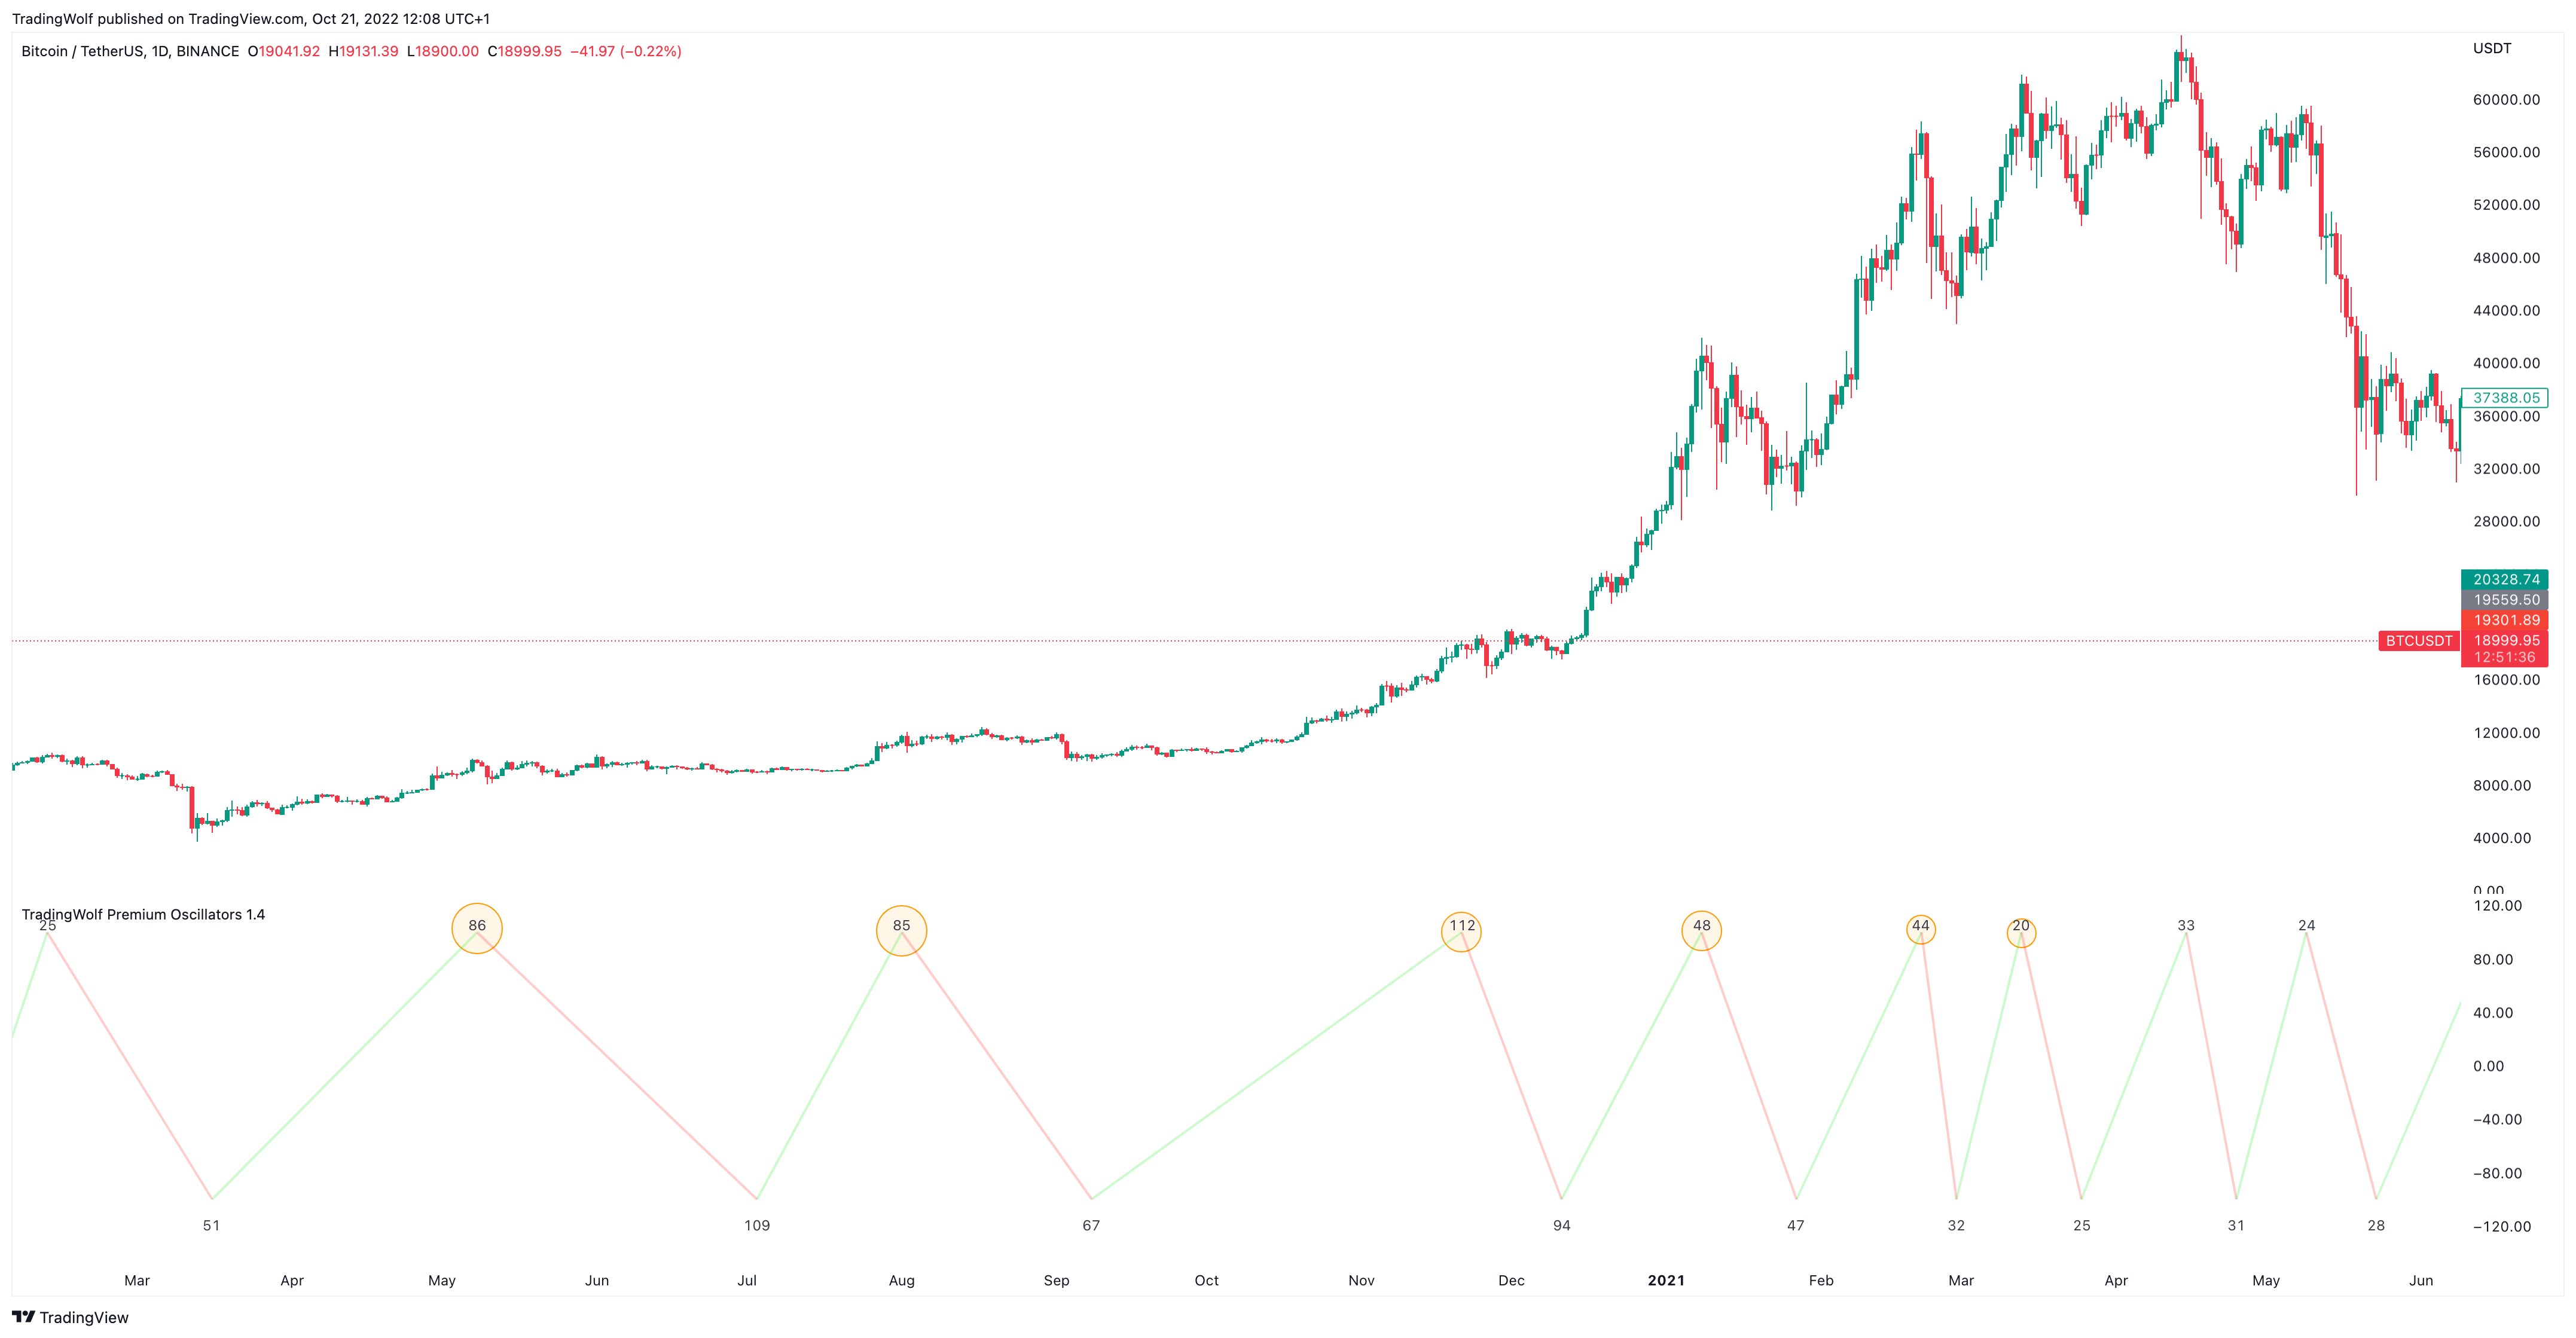
The purpose is to check if there is a common rhythm or beat in the underlying dataset. To check that, look for recurring patterns in the numbers. e.g. if you often see the same measured distance, you can conclude that there is a major dominant cycle in this market.
Also watch for harmonic relations between the numbers. So in the example below you see the highlighted cluster of detected length of around 20, 40 ,80 and 120.
Configuration
You can adjust the length the indicator scans to determine whether there is a new pivot, by default we think 15 gives the best indication.
Display
You can change the colour of the up/down trend lines and the colour of the text for the counter.
Alerts
There are no alerts currently available.