What is TradingView
Tradingview Overview
Tradingview is a charting platform and social network used by more than 30 Million traders and investors worldwide. It provides price feed from almost every financial market, such as stock, commodities, crypto, forex, etc.What is it used for?
TradingView is typically used for tracking asset prices, direct and in-direct trading, socializing in the financial market, and other remarkable things but these are the main things:
- Charting System
- Stocks, Forex & Crpyto screeners
- Alert Systems so you don't have to stare at the charts all day
- Social groups for sharing trade ideas
- A huge database of indicators to help you make trading decisions
- Broker integration
How to create a Tradingview Account
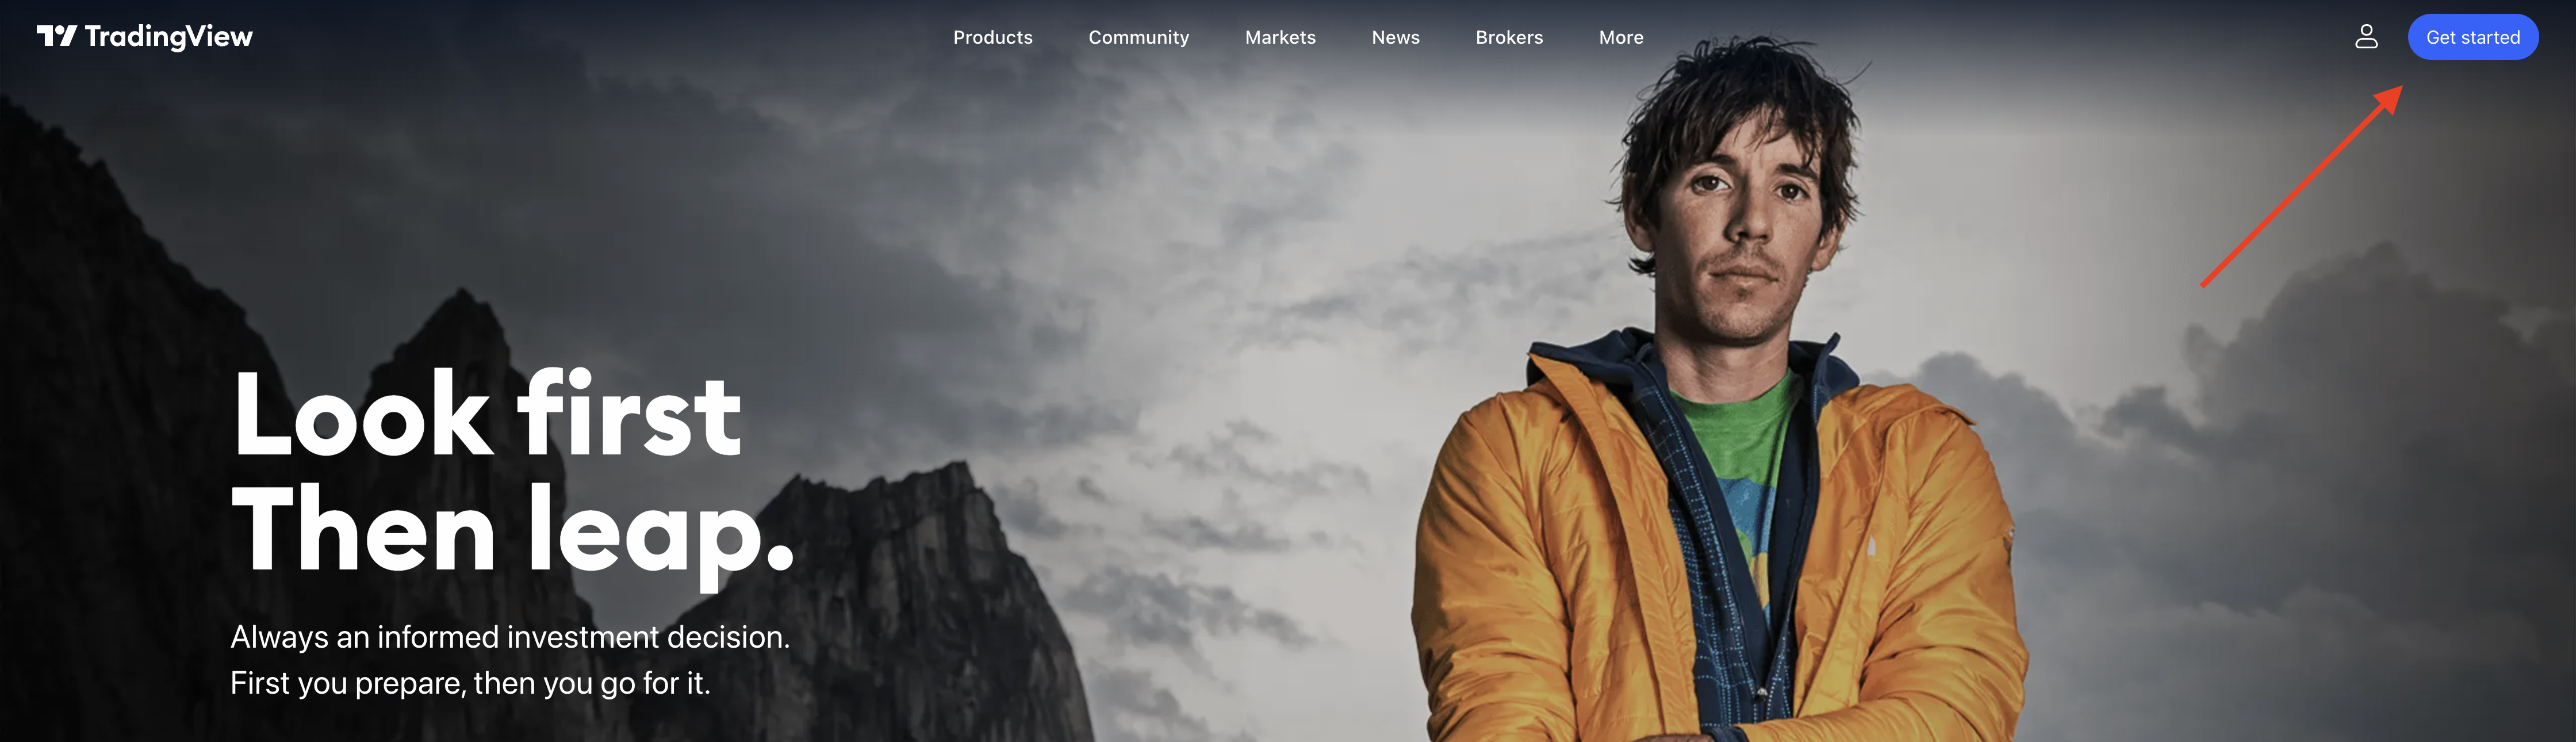
To create a tradingview account, you need to go to their website, in the top right click "Get Started" this will then take you to the ubscription plan page, if you don't want to sign up for a subscription yet, you can scroll down and try a free account. You will see on this page that in all the subscription options give you a variety of features but if you're a beginner you don't need to worry about this the only limitation you will have regarding Tradingwolf is that you can only have 3 Indicators on your chart at once. If you consider yourself more advanced you may want to scan through these features to see what may appeal to you.
Charts
Once you have signed up, across the top of the page you should see options for "Products Community Markets News Brokers More" We are going to focus on the charting aspect of Tradingview so if you hover your mouse over Products, you will see "Chart Screener Heatmaps". Click on to "Chart"
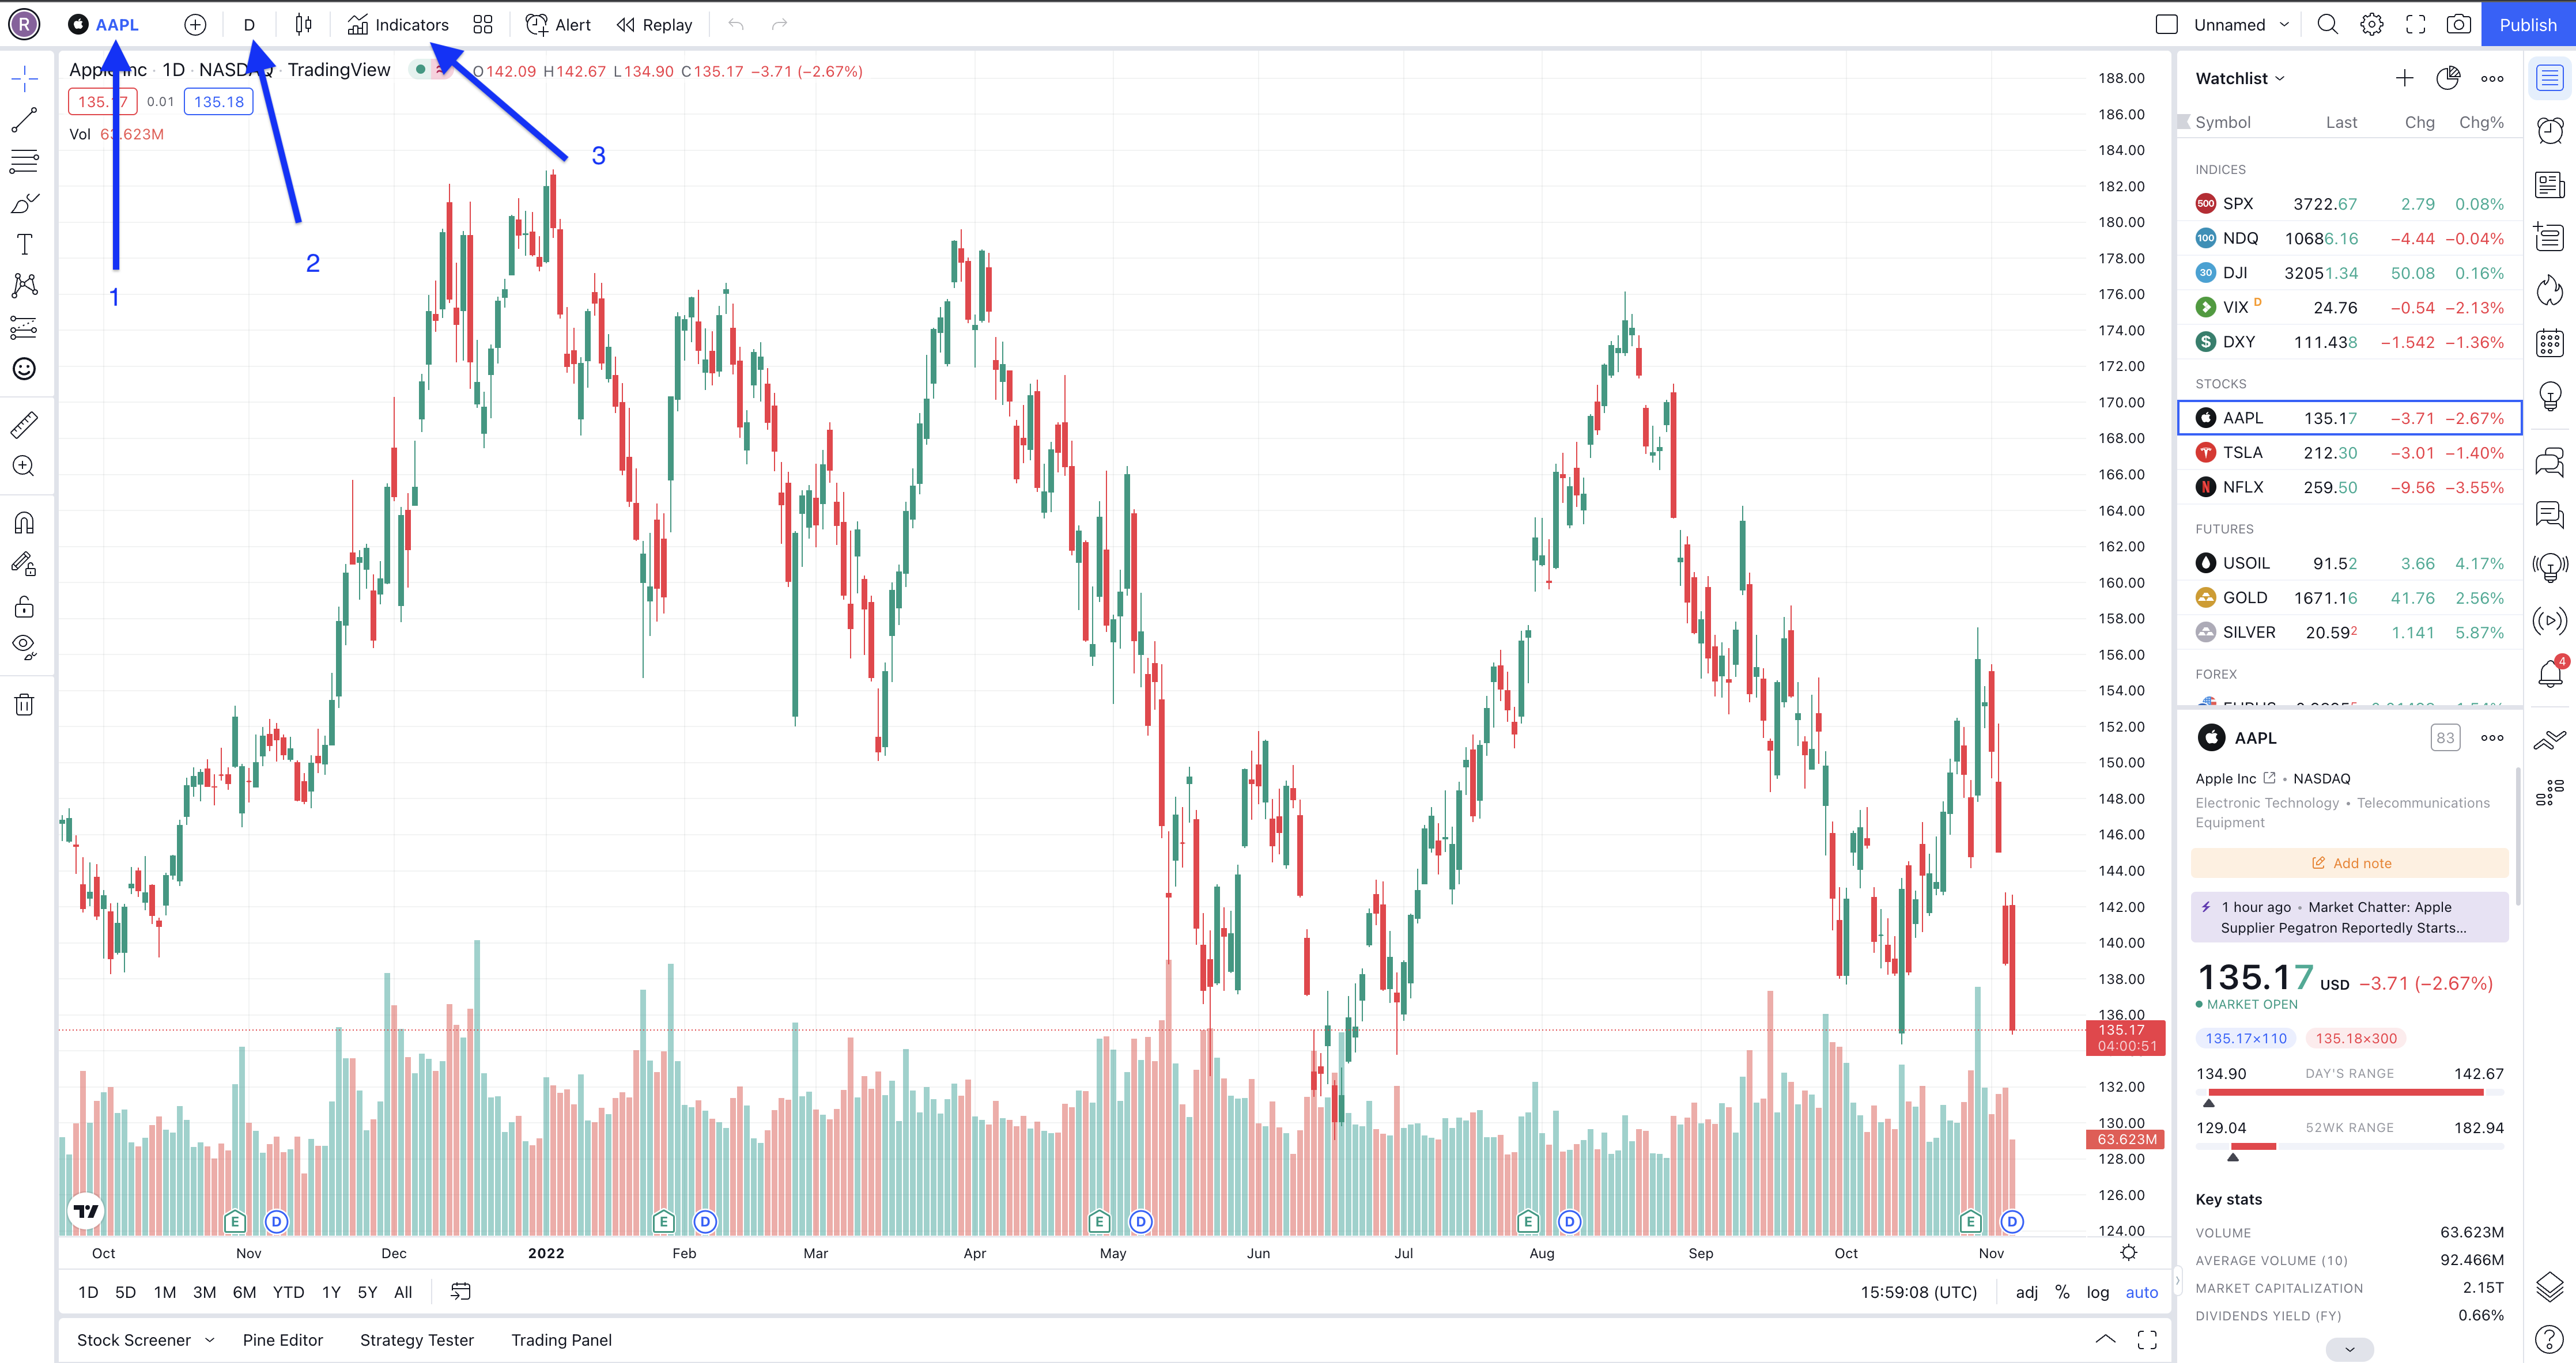
You will then be presented with a screen similar to the one shown above. There are 1000s of features you will want to know about but the 3 main important ones we have labeled here.
Tickers / Symbols
- Is showing you where you can change the symbol you are looking at, simply click on where it says the exisiting ticker and search one of, if not the largest database of live price data. Commodities, Stocks, Currencies and of course Crypto.
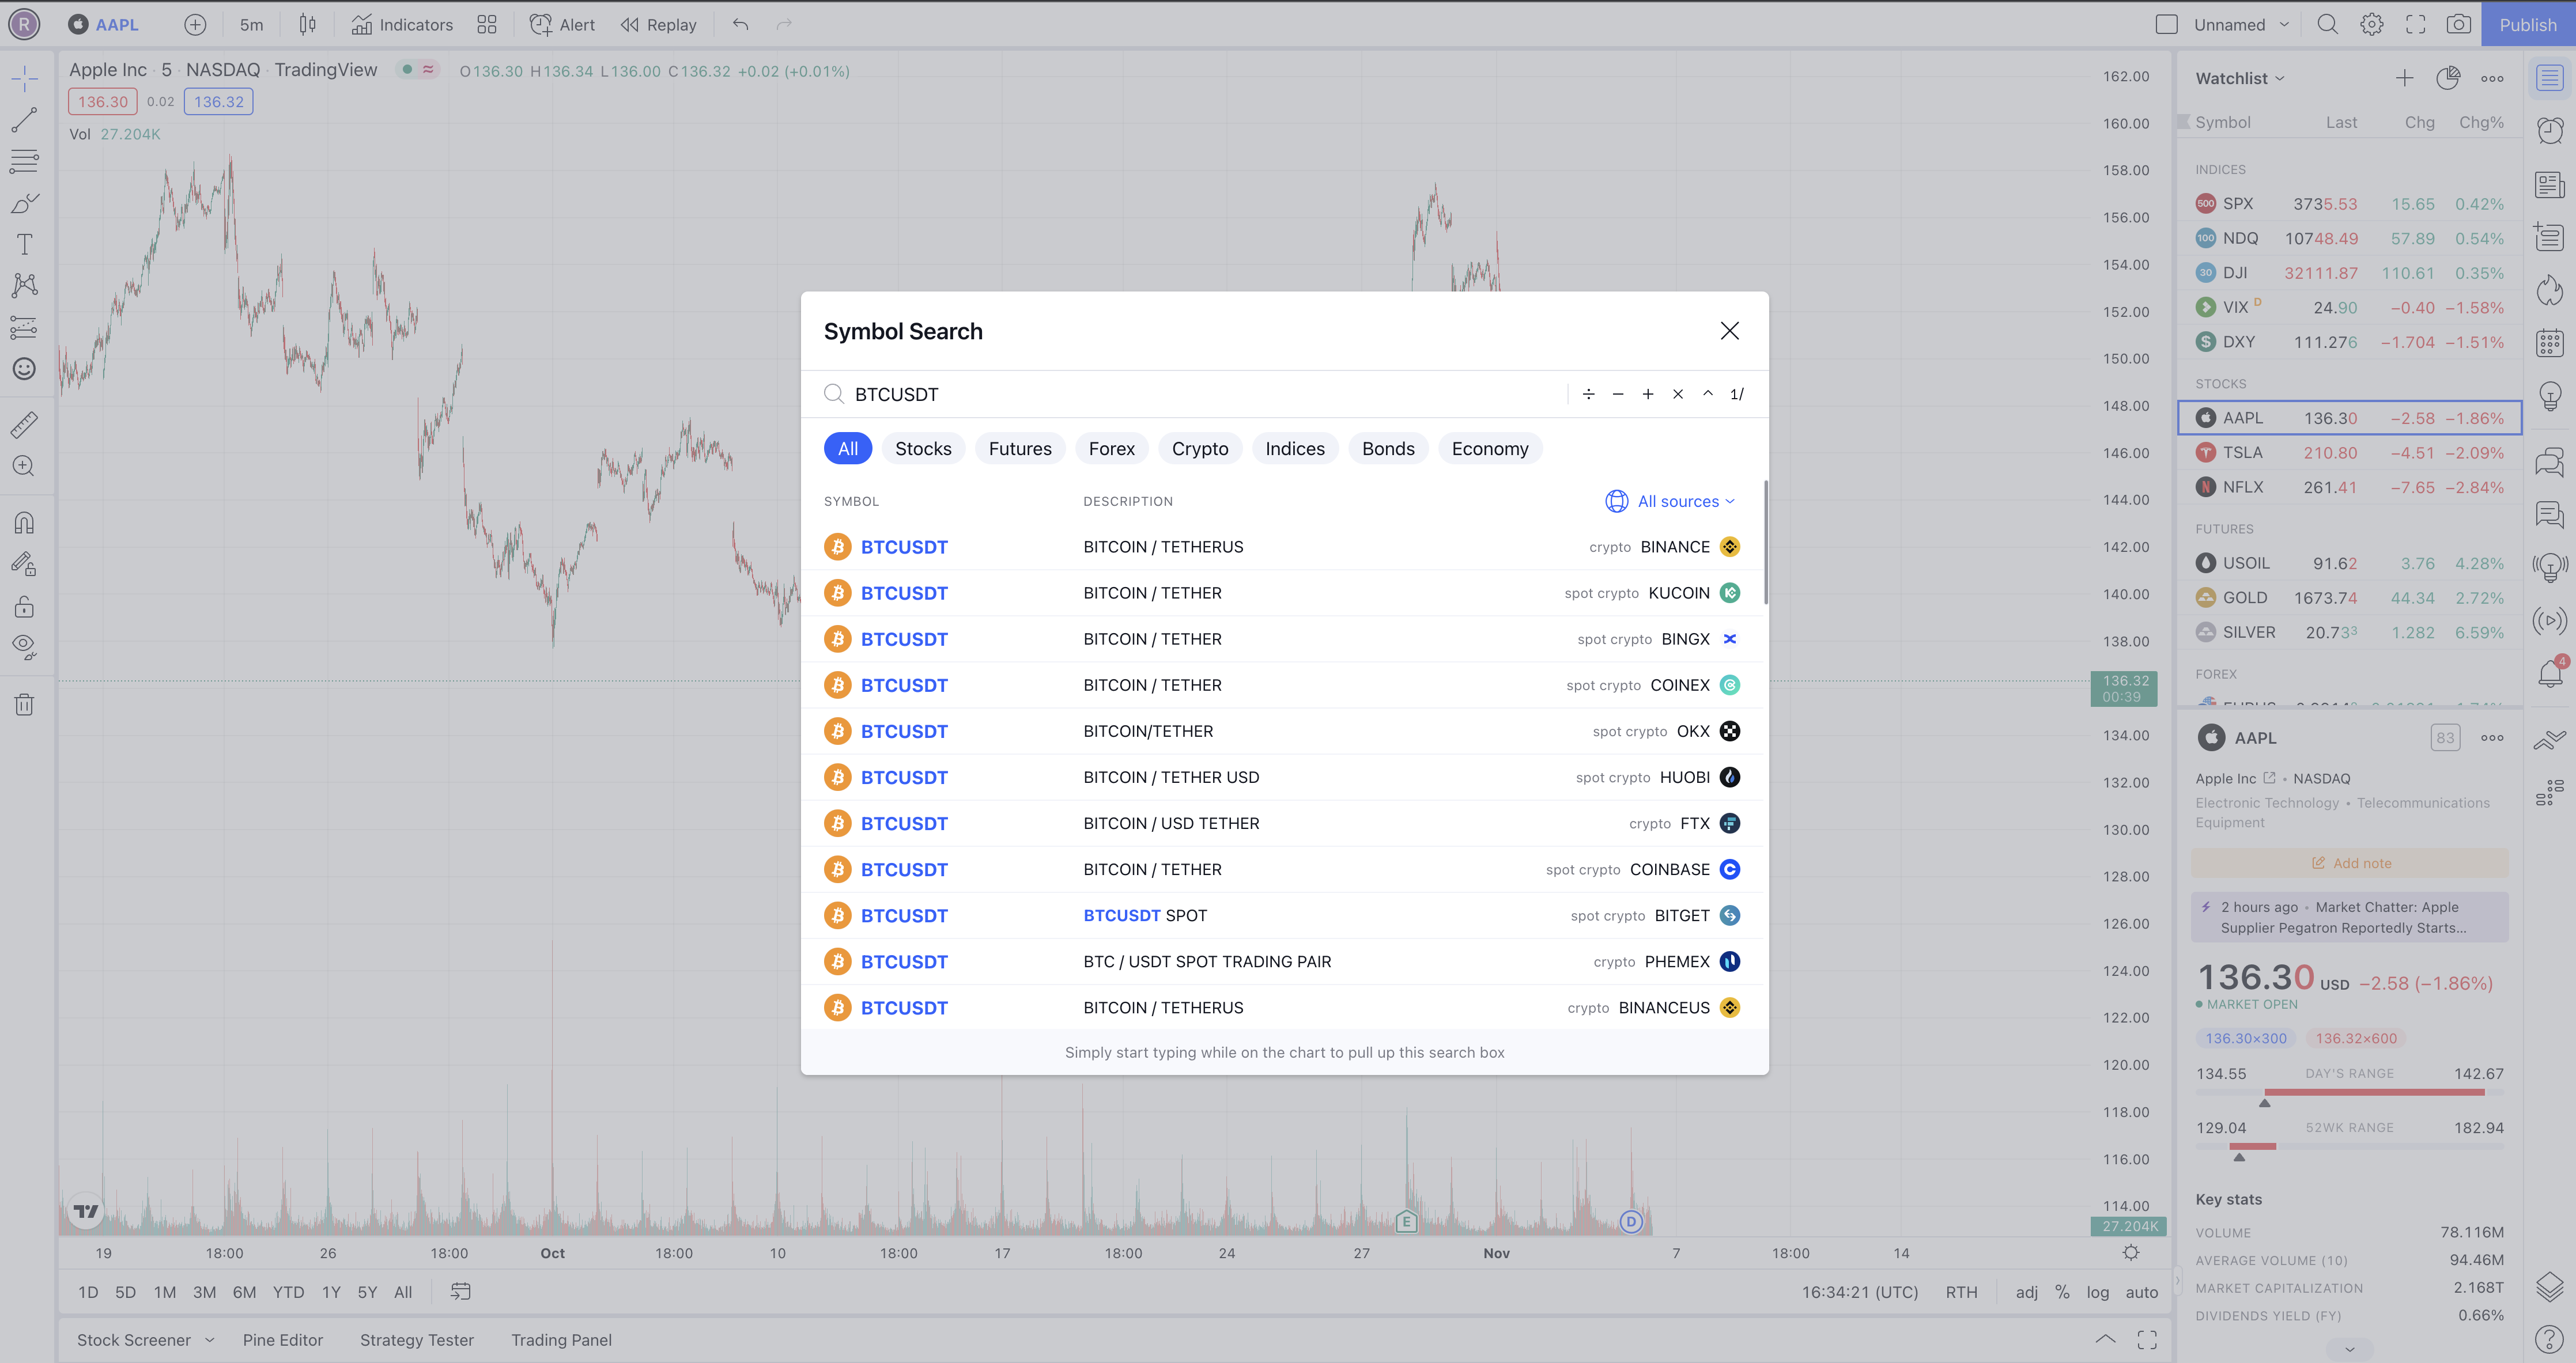
You can also change the chart my clicking one of the assets in the right 'Wathclist' panel, or you can just start typing the ticker name whilst looking at your chart...
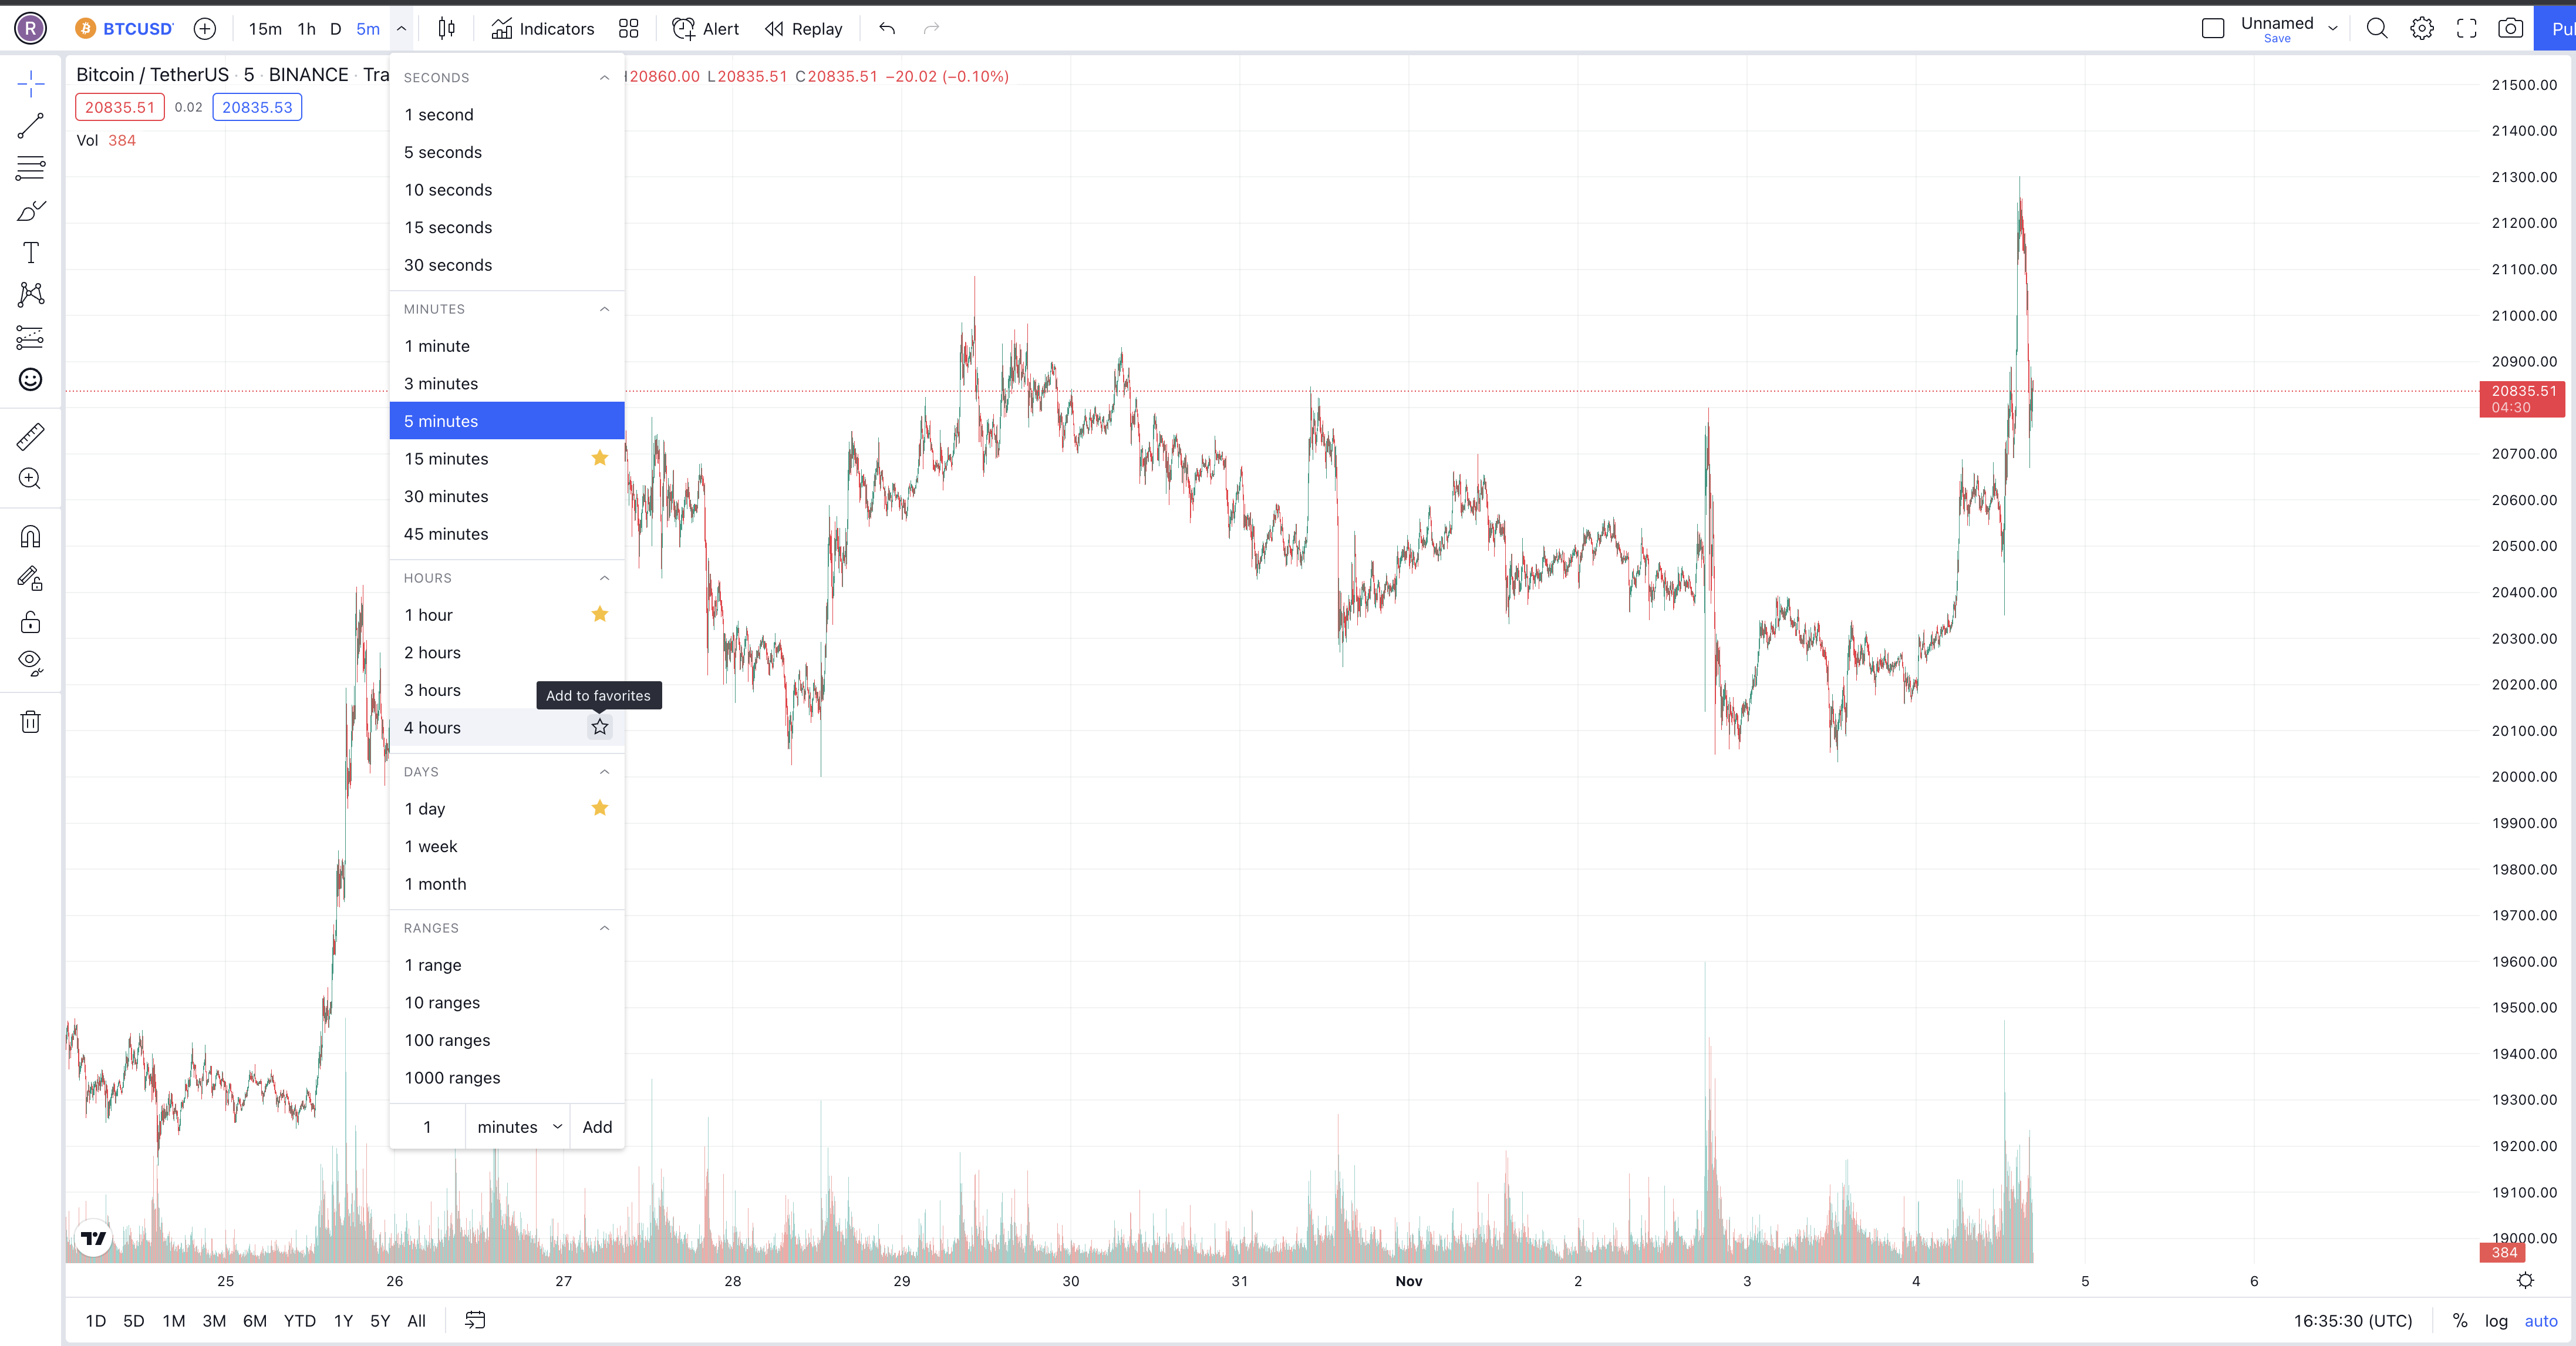
Timeframes
- Here you can change which timeframe your chart is being displayed in. E.g. if you have have 5 minute selected, a new candle will appear every 5 mintues.
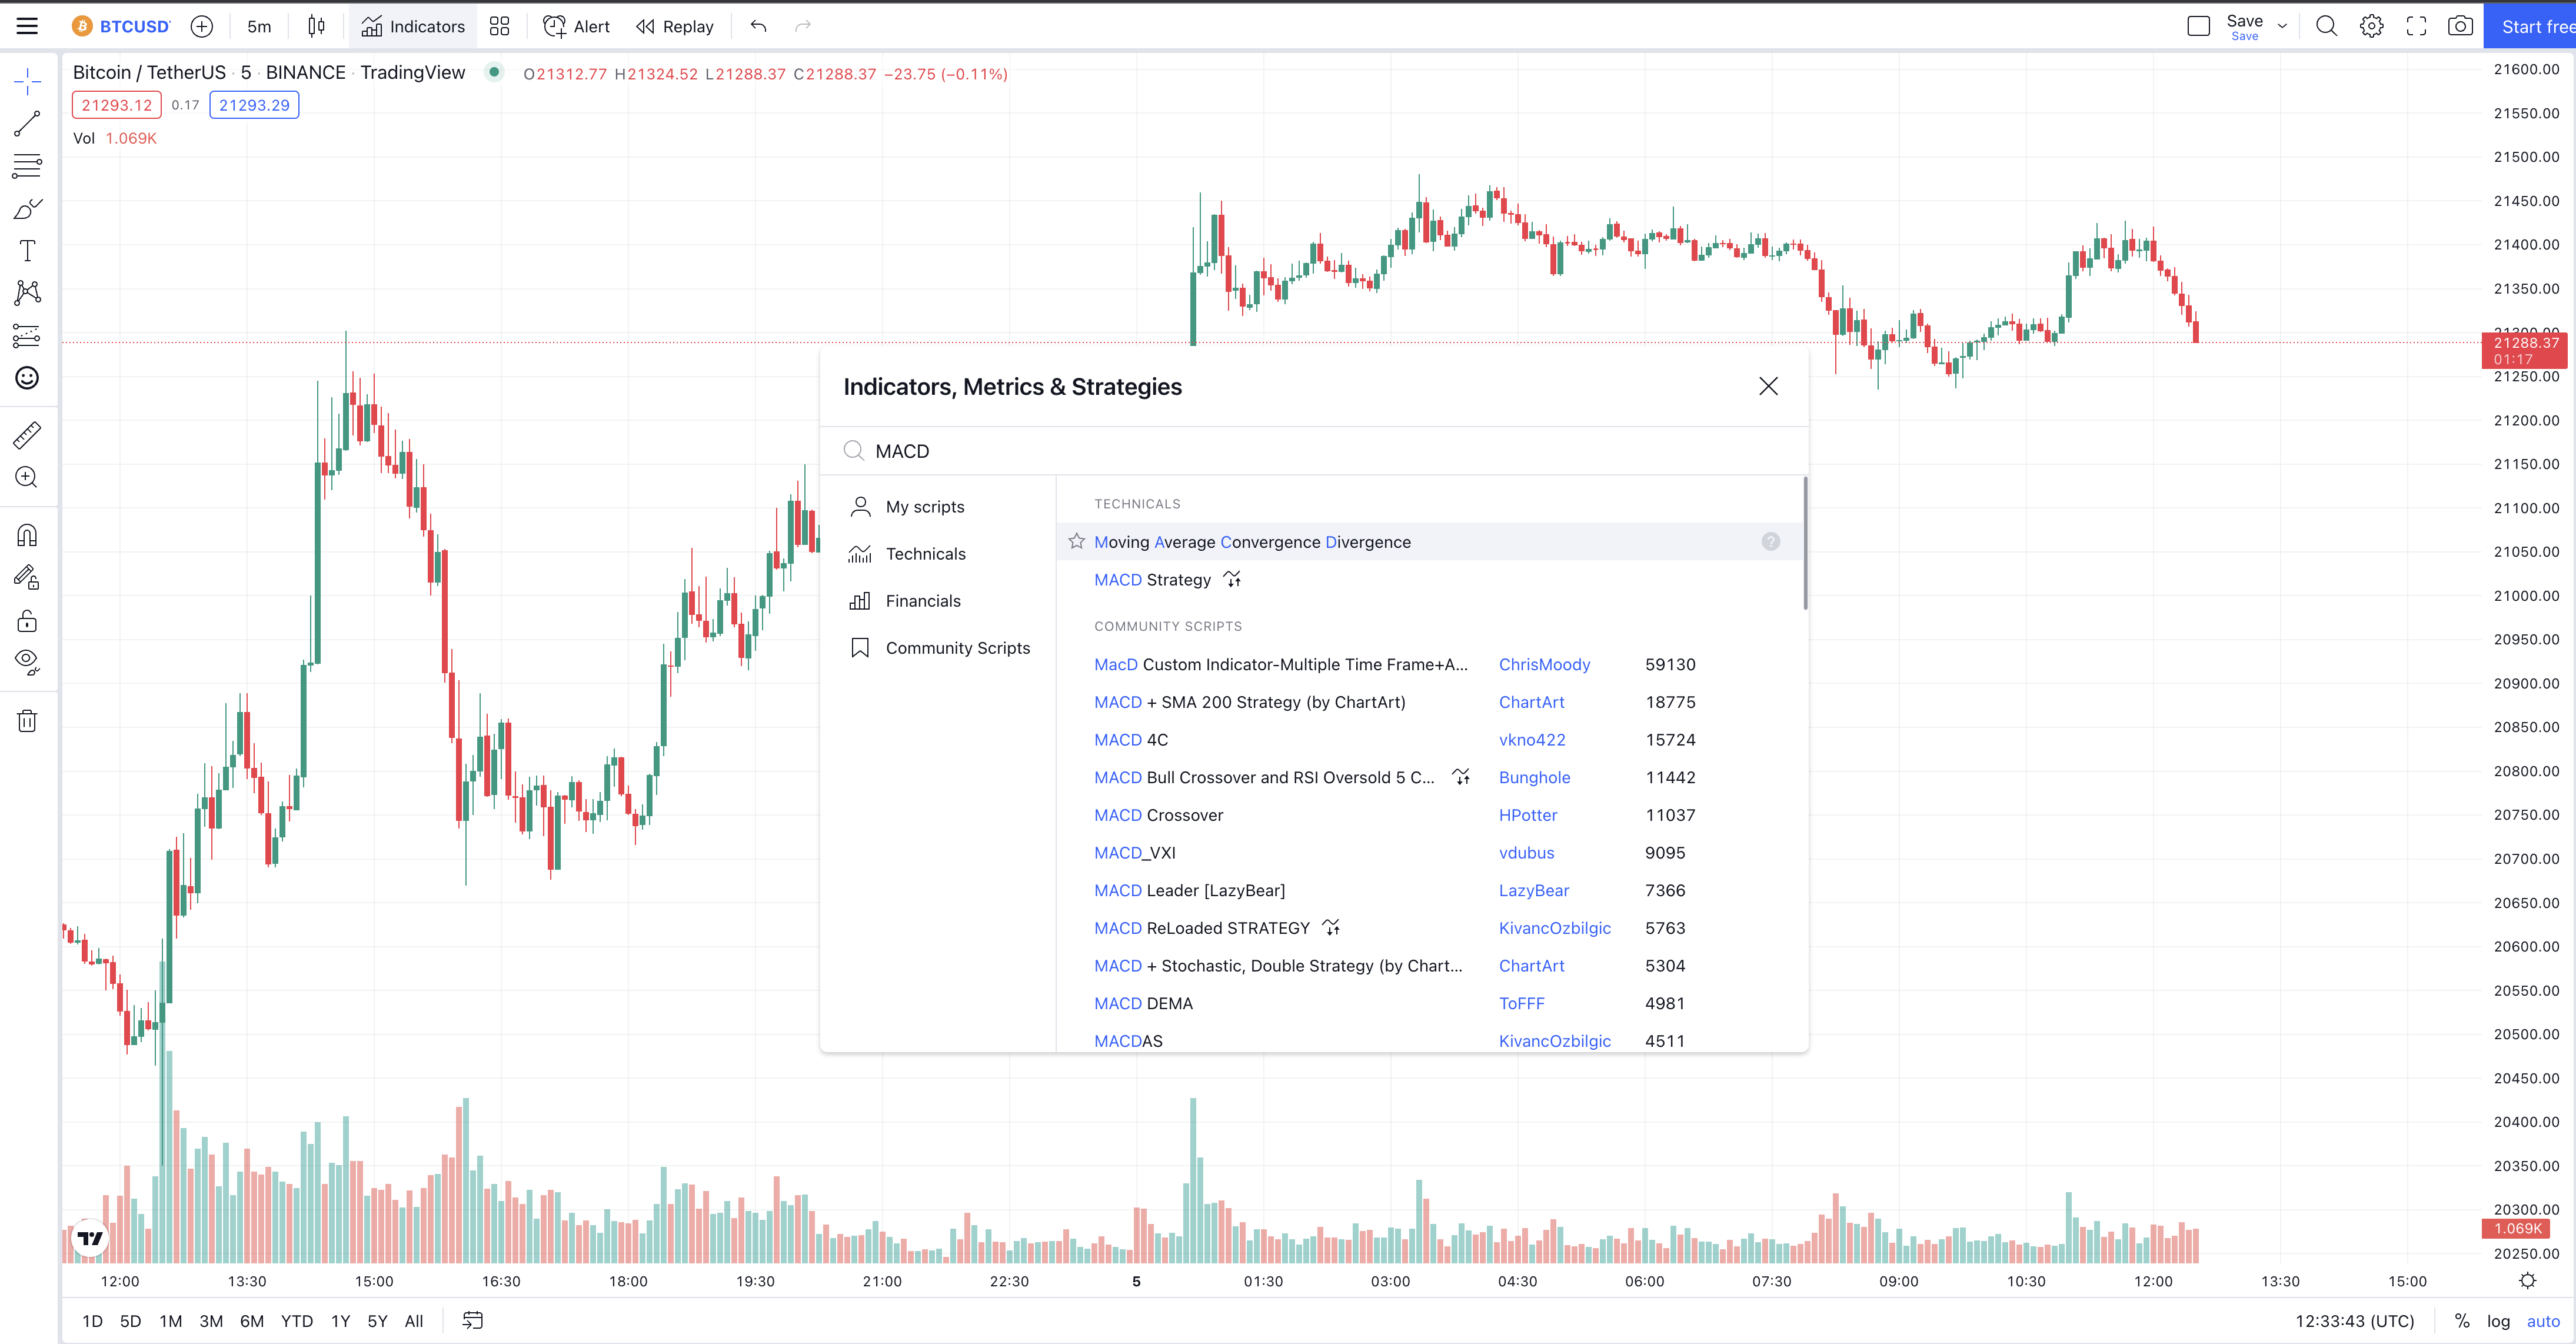
Indicators
- This is where you can find a huge database of Indicators, once you click onto this you can search Tradingviews built in and community contributed scripts. For example if you wanted to add the MACD to your chart, simply search it in the panel given. You will be presented with Tradingviews built in one but below that you will users who have contributed their own versions of the MACD,