RSI
Overview
AIf you open the settings, at the top you will notice you have a choice of oscillators you can choose to display along with what timeframe they work on. We prefer not to cluster charts too much we rather give you the option of what you would like to see.
RSI
We try not to mess with these too much because if used correctly, they are very powerful tools. Newbies will try to use RSI where you sell if it goes above 70 and buy if it goes below 30 but this is far from what you should be doing. I am going to try break down a couple ways we like to use the RSI tool.
One of the simplest is rather than buying when it goes below 30, is buying when the RSI crosses back above 30 as this signifies a change in direction. If RSI breaks below 30, this just shows that there is a strong trend and from numerous tests we have proven that you would lose a lot if you try trading this method compared to buying when the Oscillator comes out of these overbought/sold areas.
Another method is using the 50 Level, this is a great point to keep an eye on, especially on high timeframes (4H - Weekly) as they can show turning points in the trend, or act as confirmation on support/rejection.
We have added interest zones which will highlight when the rsi moves into the 47-53 area.
We don’t recommend taking trades using this solely but use it with confluence with other parts of the indicator to gain a higher probability.
We have also included a MA on the RSI which can act as support/resistance or just help give an idea of the macro trend as it's based on a larger time frame of data.
Finally we have Divergence signals, Divergence signals are hugely popular, especially on the RSI, they can be great signs of continuations and reversals. These signals ar eno guarantee and should be paired with other parts of confluence, we particularly like using divergence signals against the 50 level on Higher time frames as they can give a good confirmation with a very profitable risk/reward.
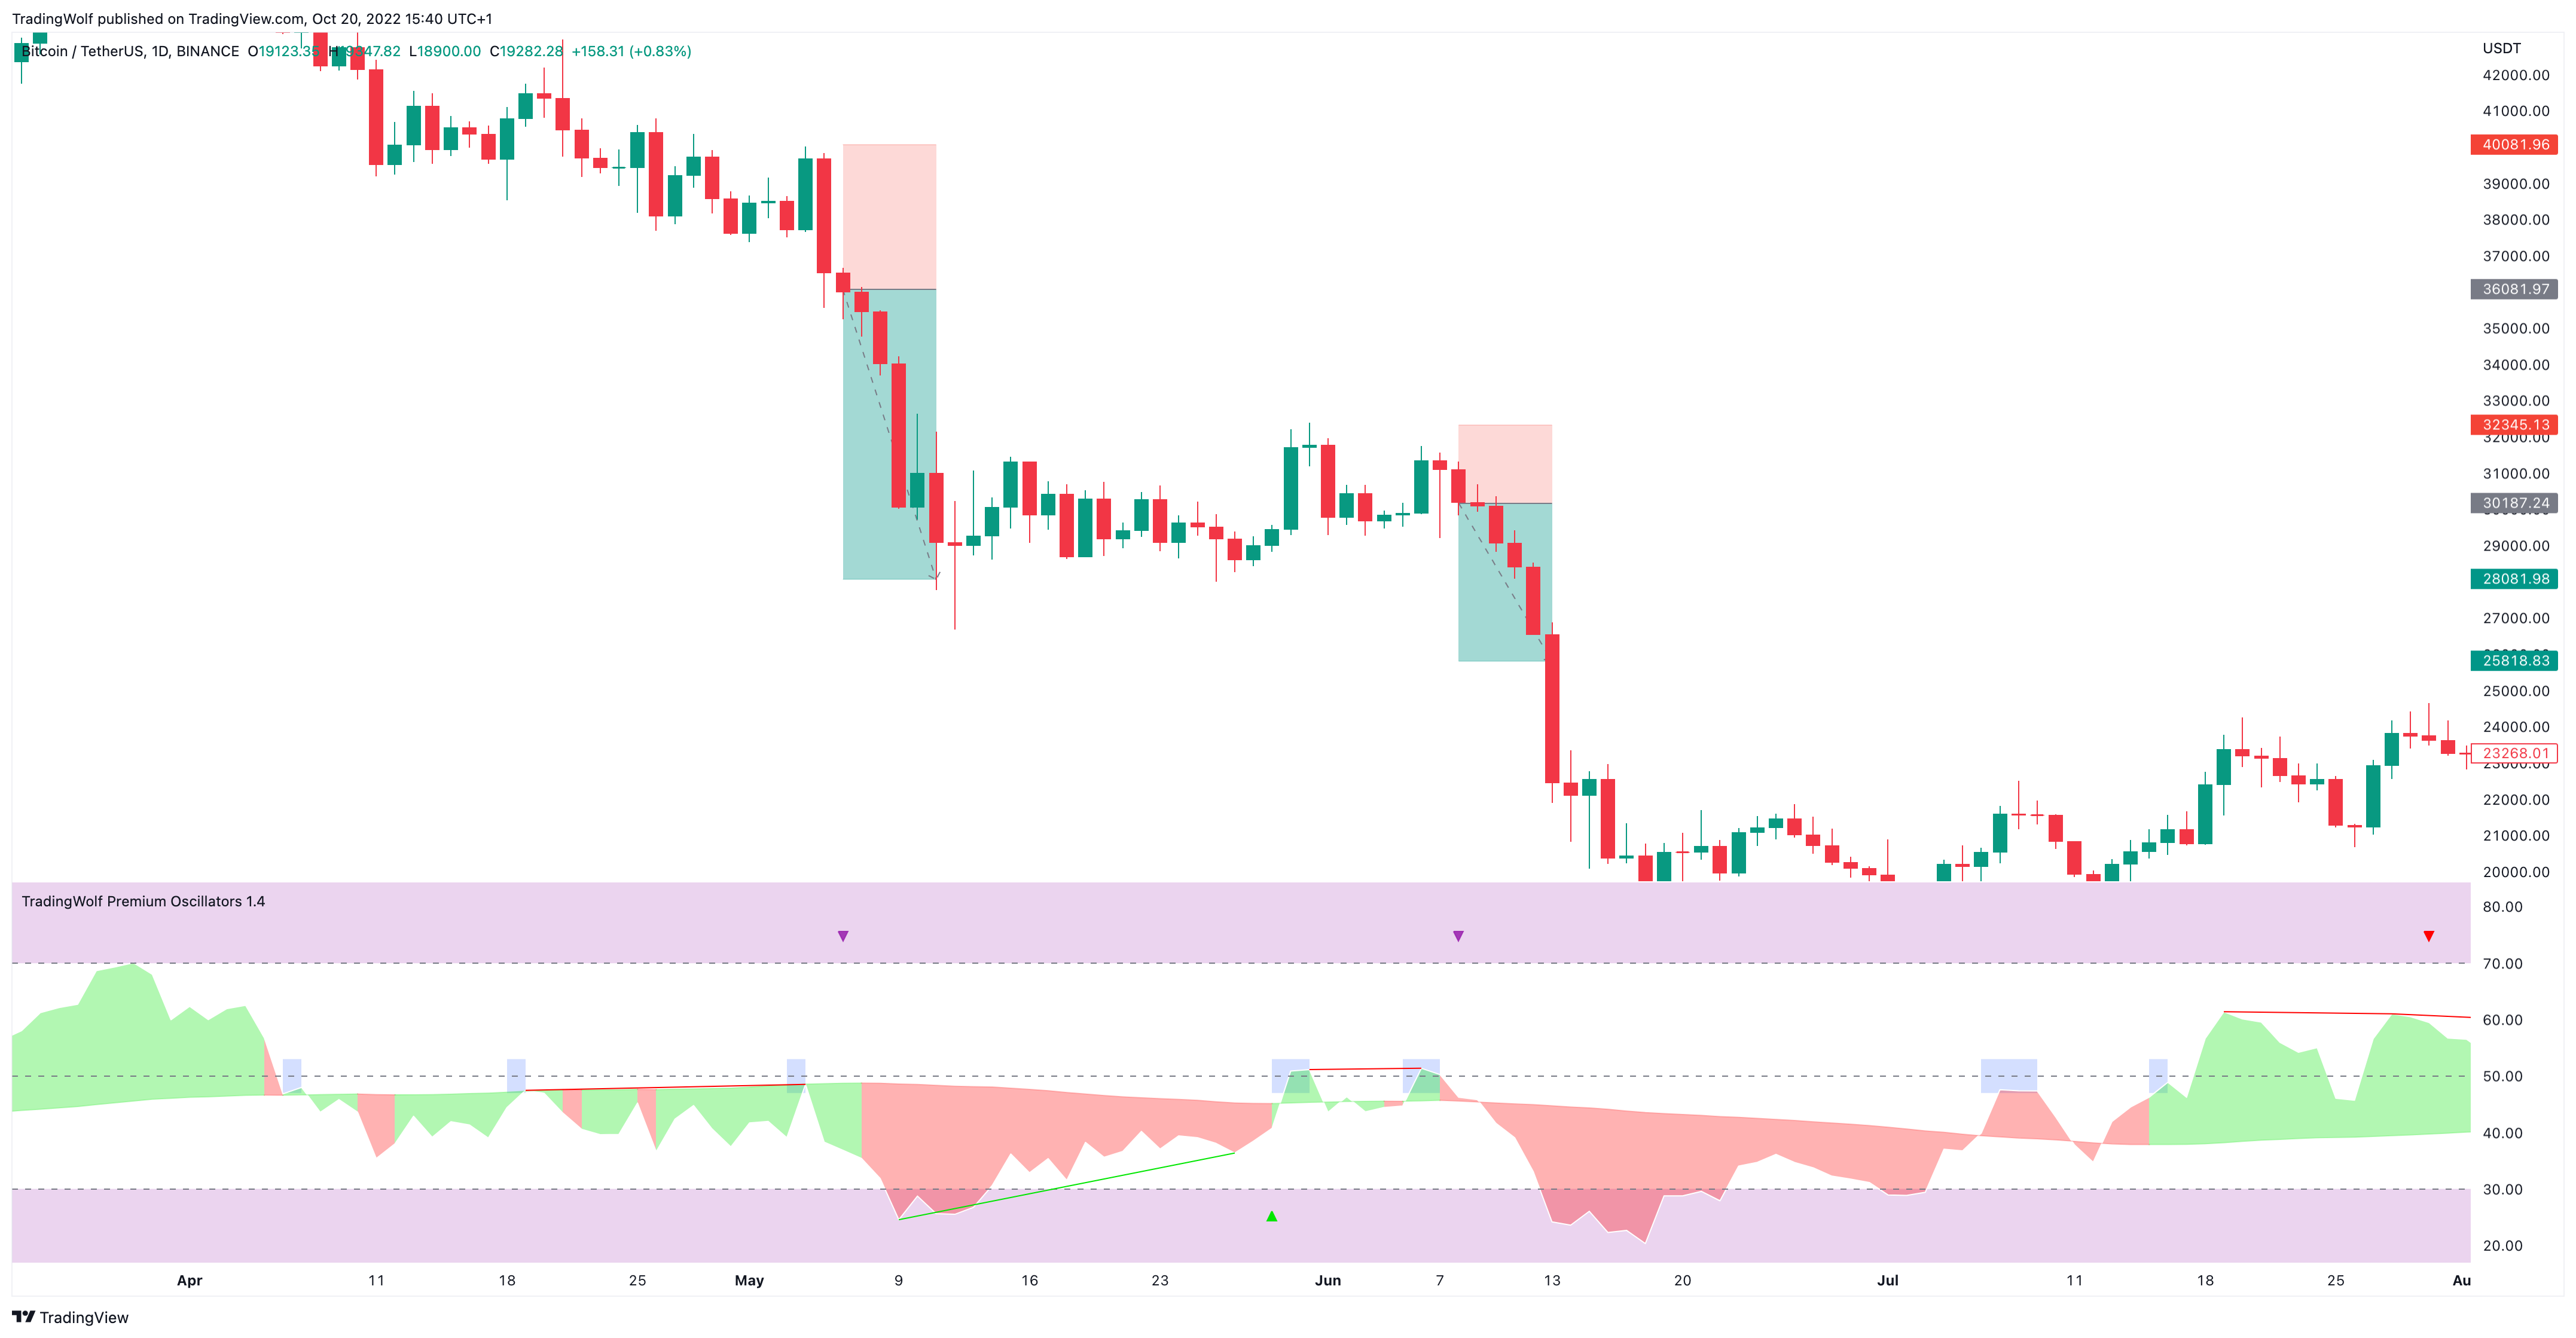
In the below example we are given 3 divergence signals, 2 are bearish and 1 bullish.
The divergence signals are confirmed when we see a star appear, they do not appear where the lines are displayed as we need 2 candles to confirm that it is a valid divergence. These still give great entry points as we can see, the 2 bearish divergence signals are given in the interest zone which gives us the confluence we need and a great risk:reward trade, we traded these with on a 1:2 ratio but if you used our trend dots you could have caught much bigger wins.
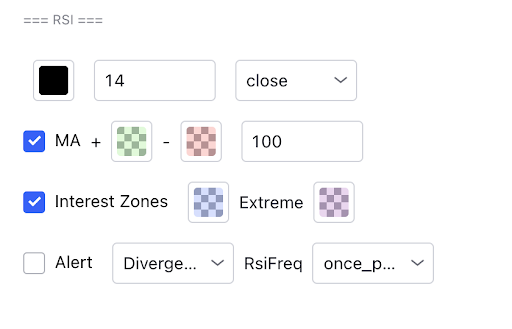
Configuration
Some people like to change their RSI lengths to give slightly different signals, the most common alternate we have seen is 9 but we have left the length option in the setting so you can choose your preferred length and source. You can also adjust the MA length.
Display
You can change the RSI colour, enable/disable the MA display along with their colours and finally the Interest zone highlighted.
Alerts
To set an alert, toggle the alert button in the RSI section of the settings, you will notice you have a few options:
- Crossing Below 70 /Crossing Above 30
- In 50 zone
- Divergence
You can also adjust the frequency the alerts are sent, we recommend using ‘once per bar close’ for the Crossing 70/30 and the Divergence signals, however, for the 50 Zone you may want to use ‘Once per par’ so you have time to hop on the chart and manage your trade idea manually.