MACD
Traditional MACD with a few changes, the main one you will notice is there is no Histogram, the histogram doesn’t provide any information which is already available from the MACD lines.
The Histogram simply displays if the MACD lines crossover one another, histogram displays this when it crosses red/green. Iif the MACD lines get closer together this suggests weakening momentum, displayed as faded bars on the histogram.
For this reason we decided not to include it and keep the Oscillator as slick as possible.
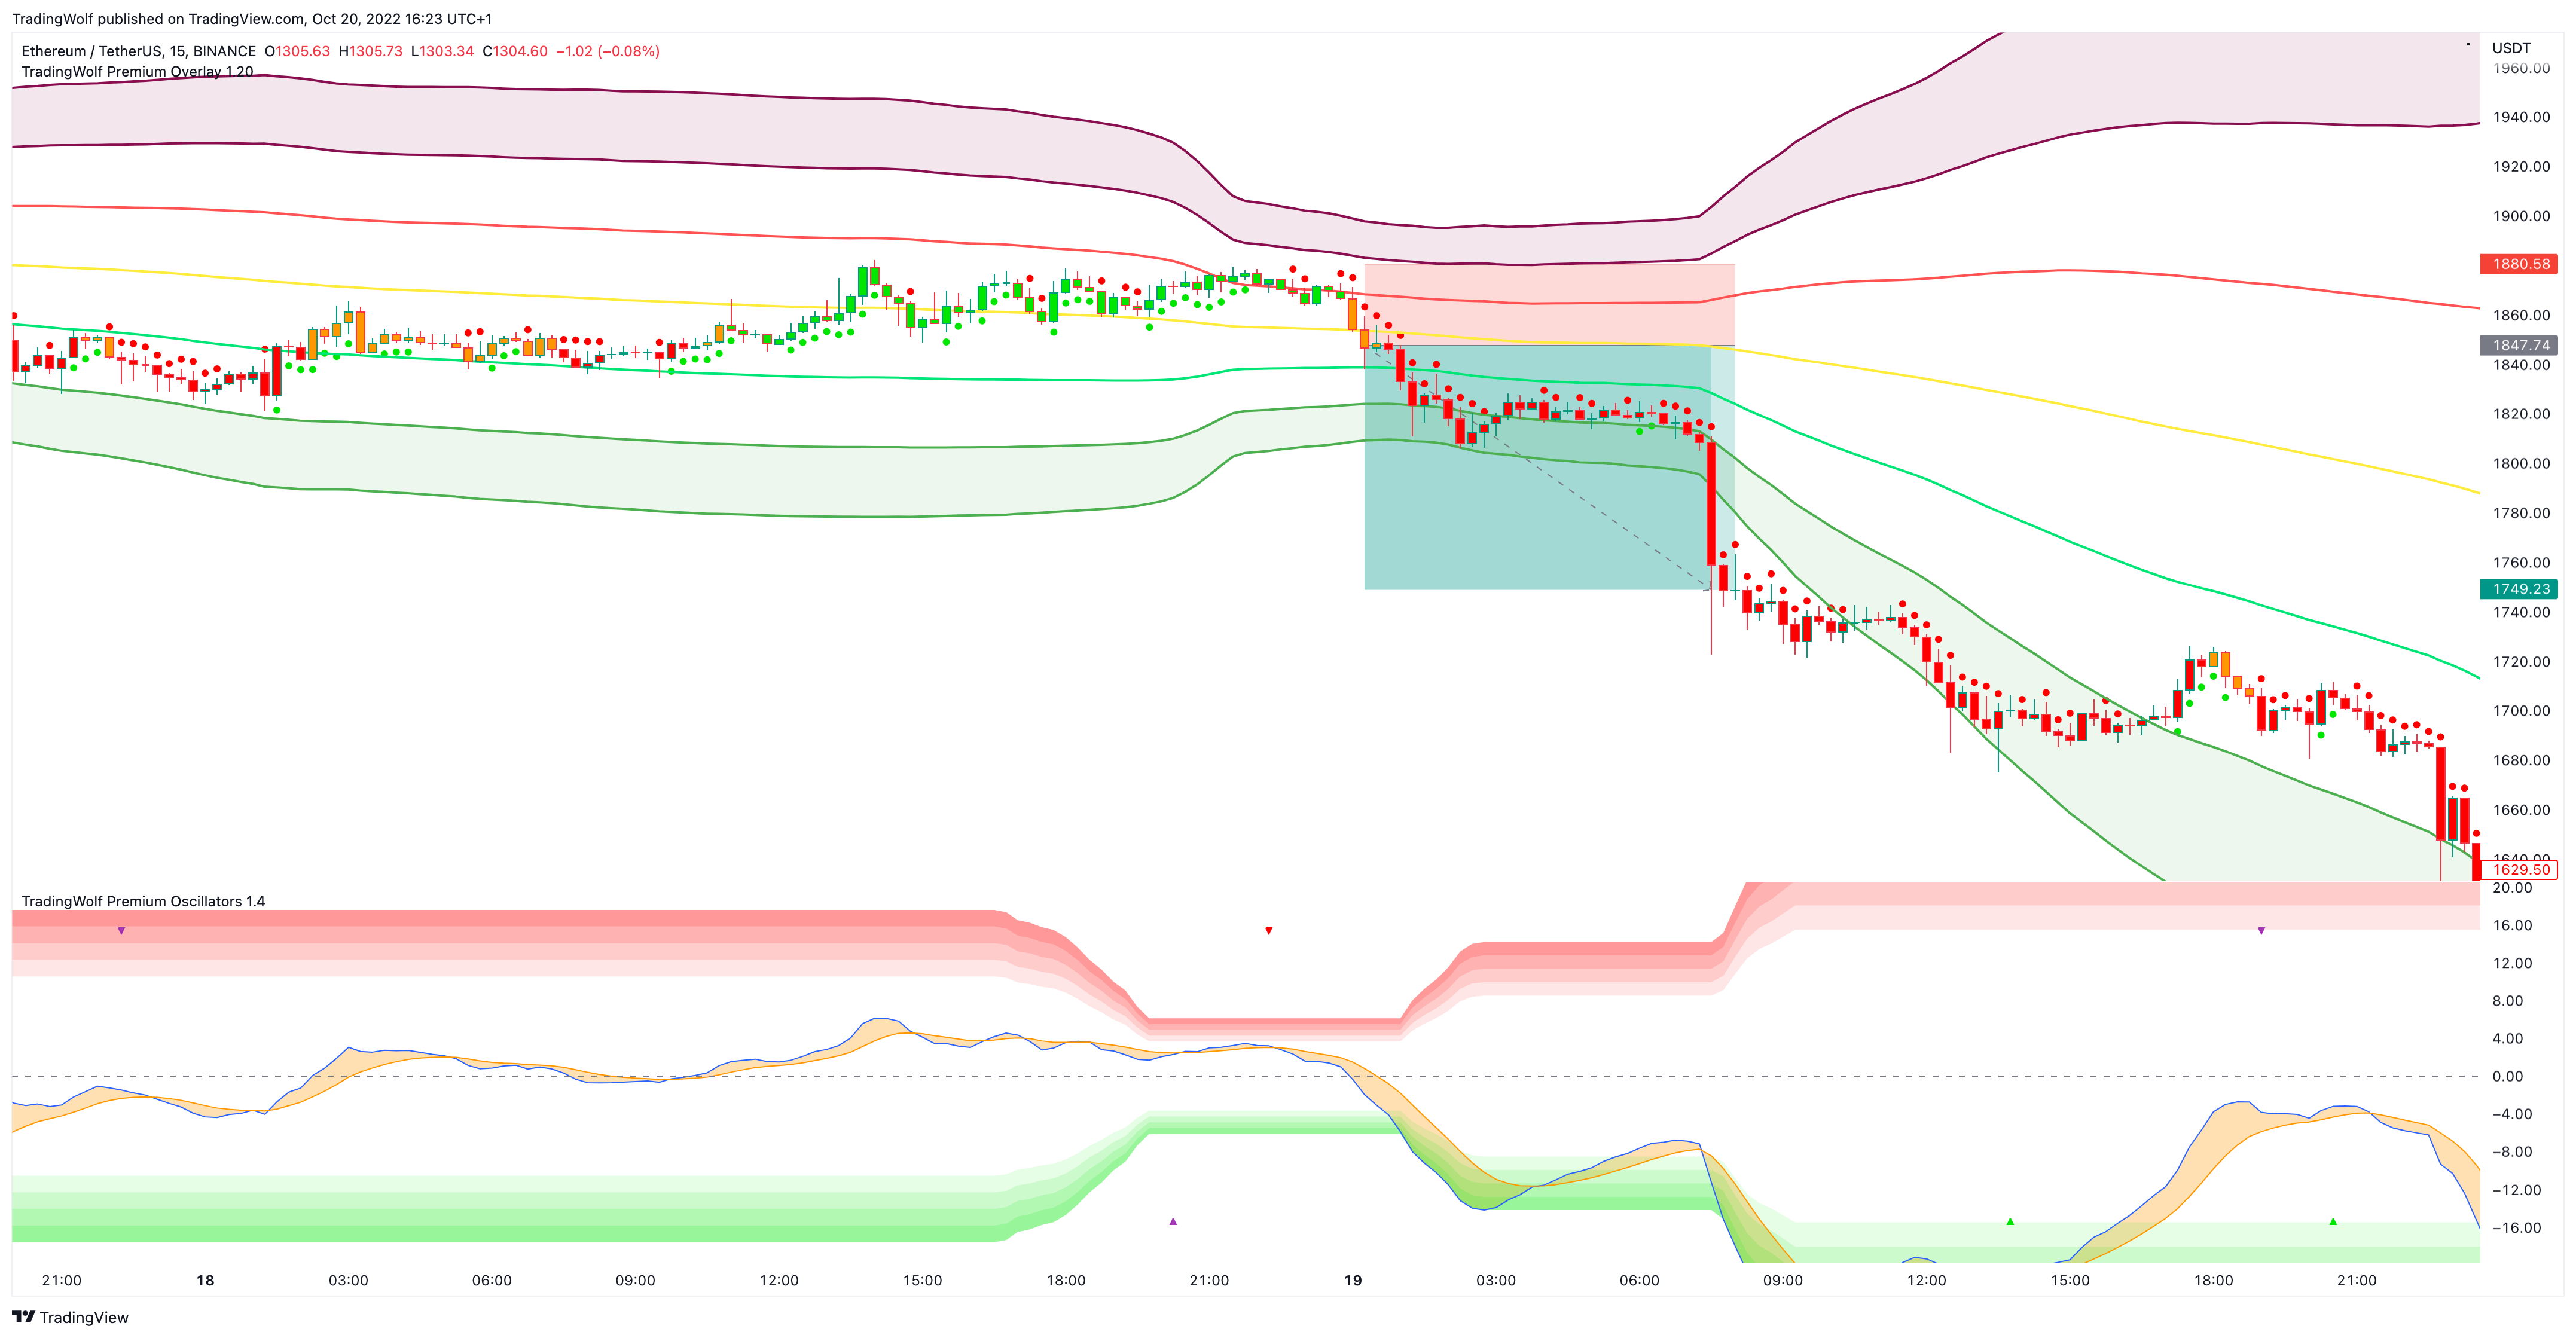
We have calculated a dynamic extreme range for the MACD, you will notice the green/red bars as the bottom and top of the Oscillator. These levels help adjust with the assets volatility so they will work universally on all assets and timeframes. When these levels get more narrow, this indicates there is a potential larger move to come.
We like the Divergence signals you receive whilst in this OB/OS range as they give more confluence behind the Divergence signal that price has over extended and is looking to retrace or consolidate.
A Trade example below where using a MACD Divergence, MACD bands squeeze, triple bands squeeze, crossing middle band line, red trend dots, break down signal ... . How much more confluence do we need?

This trade example was done with just a 1:3 risk:reward however if you used trailing exit, the asset is currently down -20% from this entry point!
Configuration
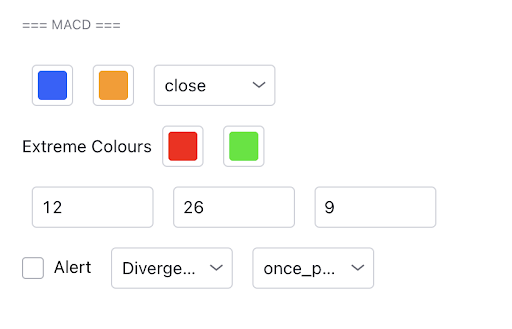
You have the ability to change all the MACD lengths, including its source.
Display
You can change the colours of the MACD and Signal lines.
Alerts
To set an alert, toggle the alert button in the MACD section of the settings, you will notice you have a few options:
- Crossing in Extreme
- Divergence
You can also adjust the frequency the alerts are sent, we recommend using ‘once per bar close’ for these alerts. You may want to test the Crossing in Extreme option on once per bar so you can be on your chart ready for the confirmation but this will depend on your trading style.
