Peaks and Throughs
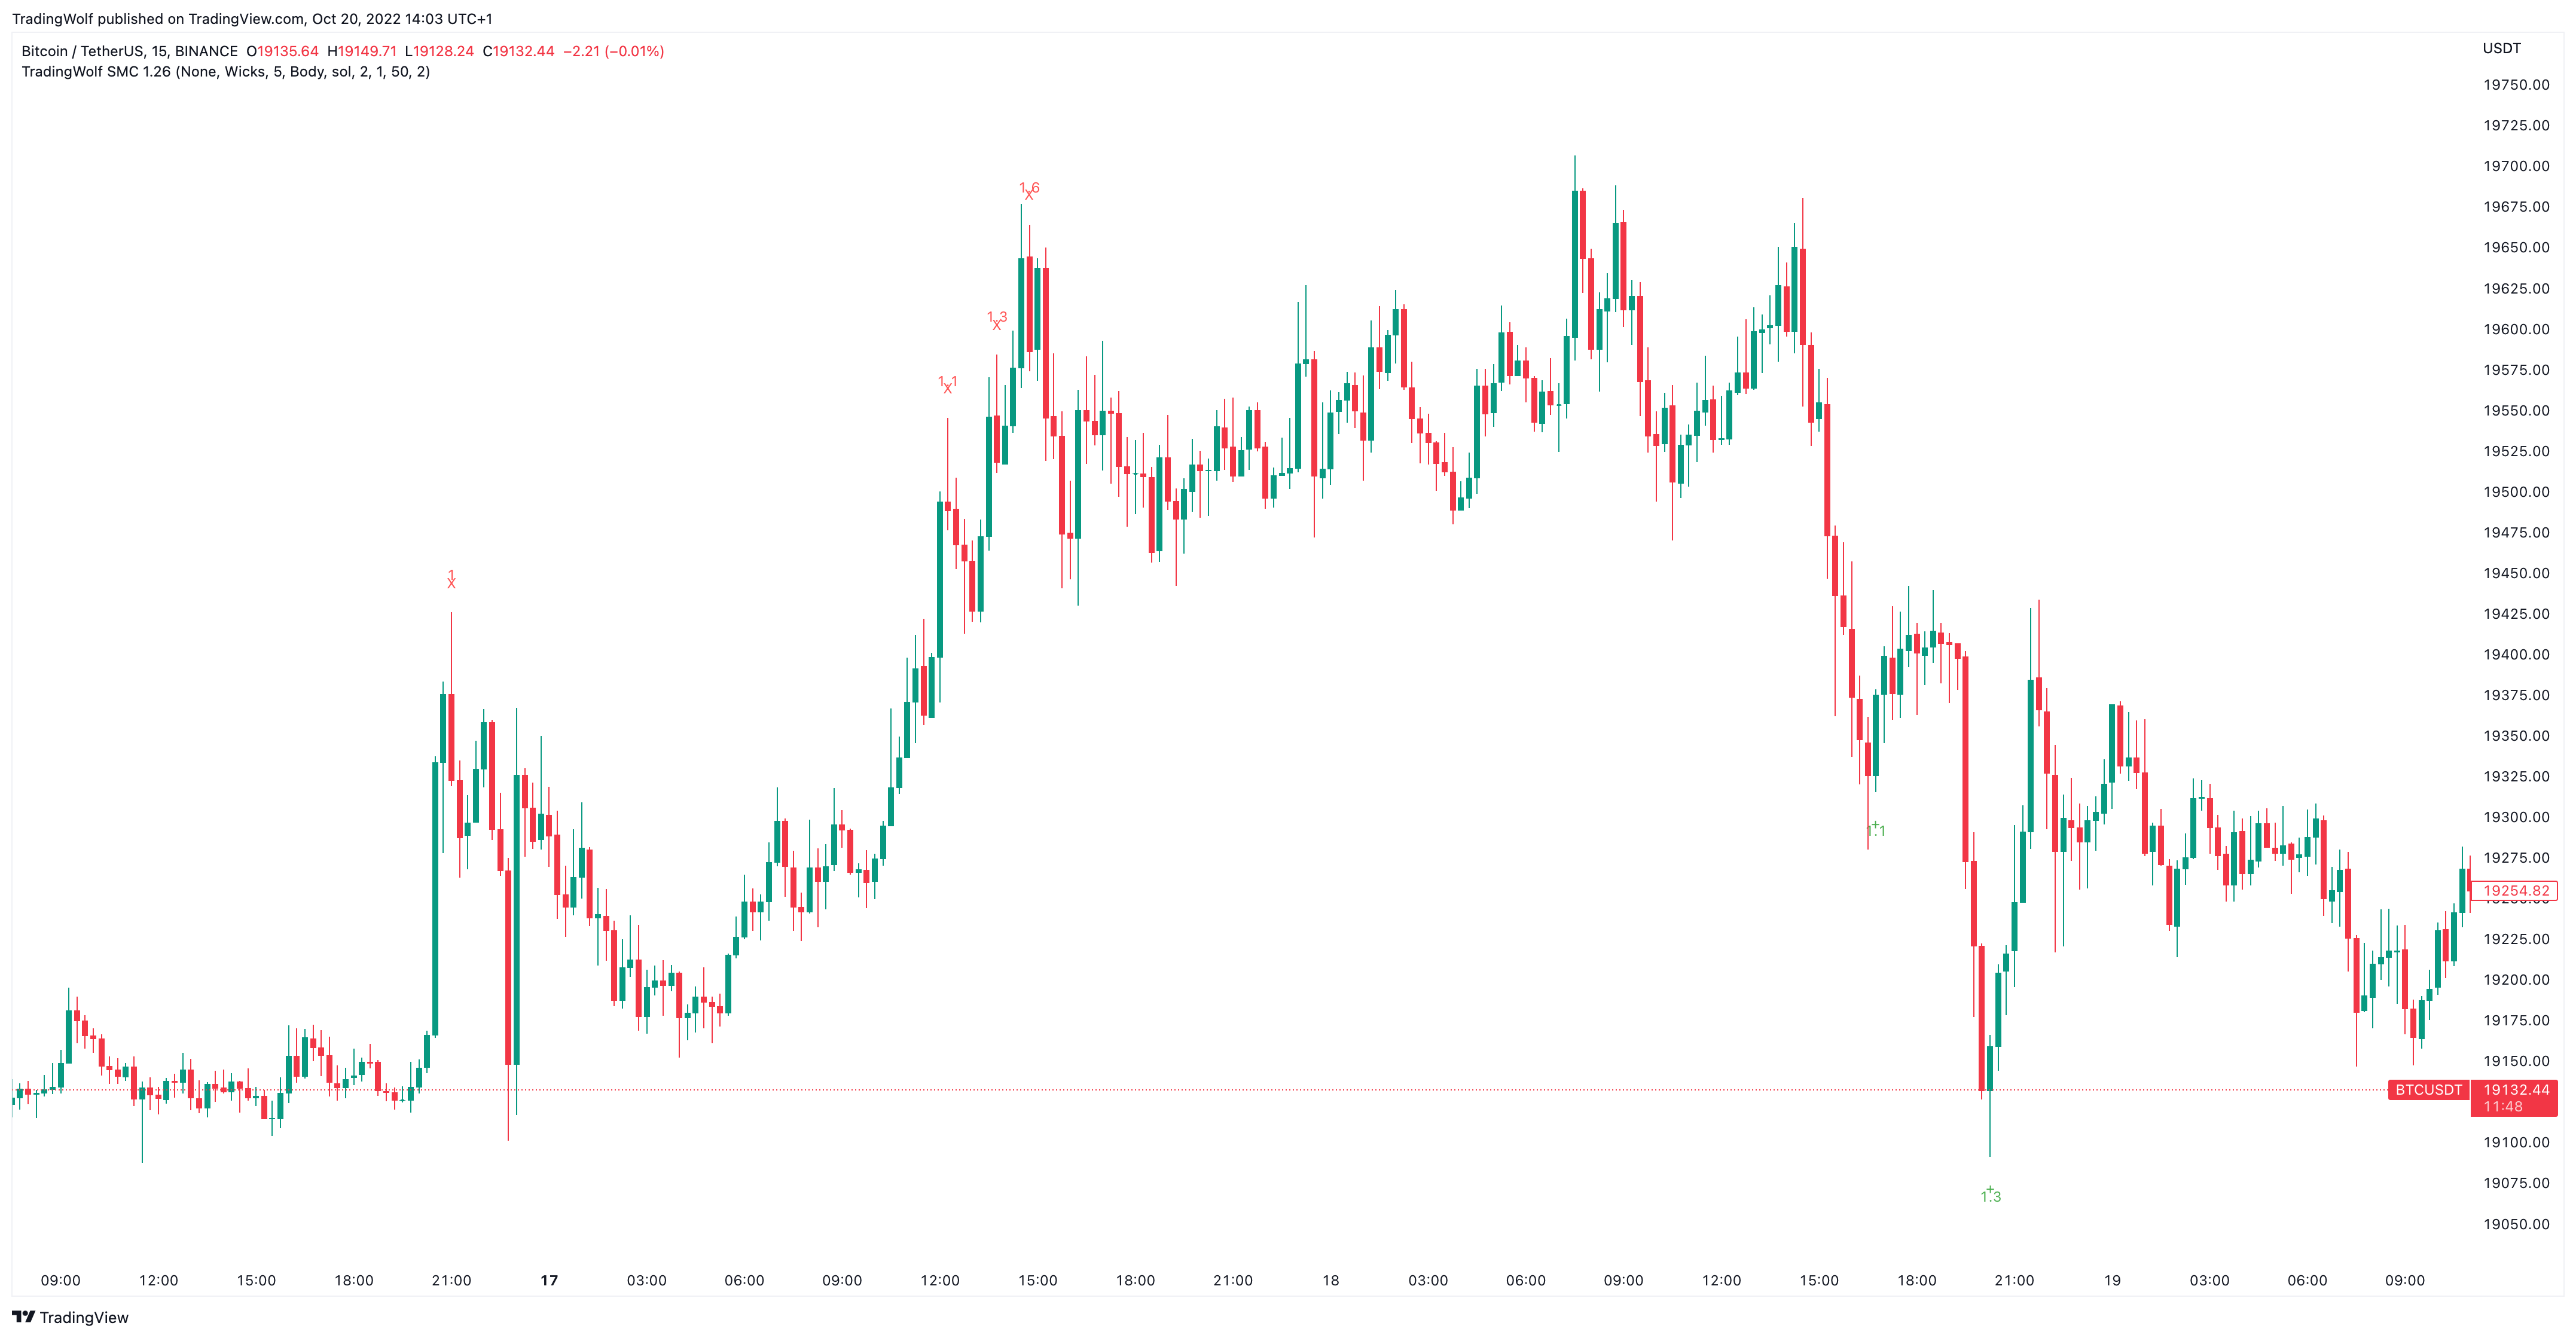
This tool helps you find potential reversal points in your support/resistance area, Simple candlestick patterns but incredibly powerful when used in confluence with our other tools.
This signal can also display the % change between these peaks and troughs with an option to only show levels which reach a certain % requirement.
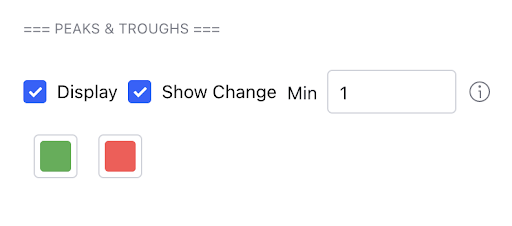
Display
You have the option to enable/disable the Signals, change values or both. You can choose the minimum allowed values to be displayed and then change the colours of the Bullish and bearish Peaks & Troughs.