Volume Profile
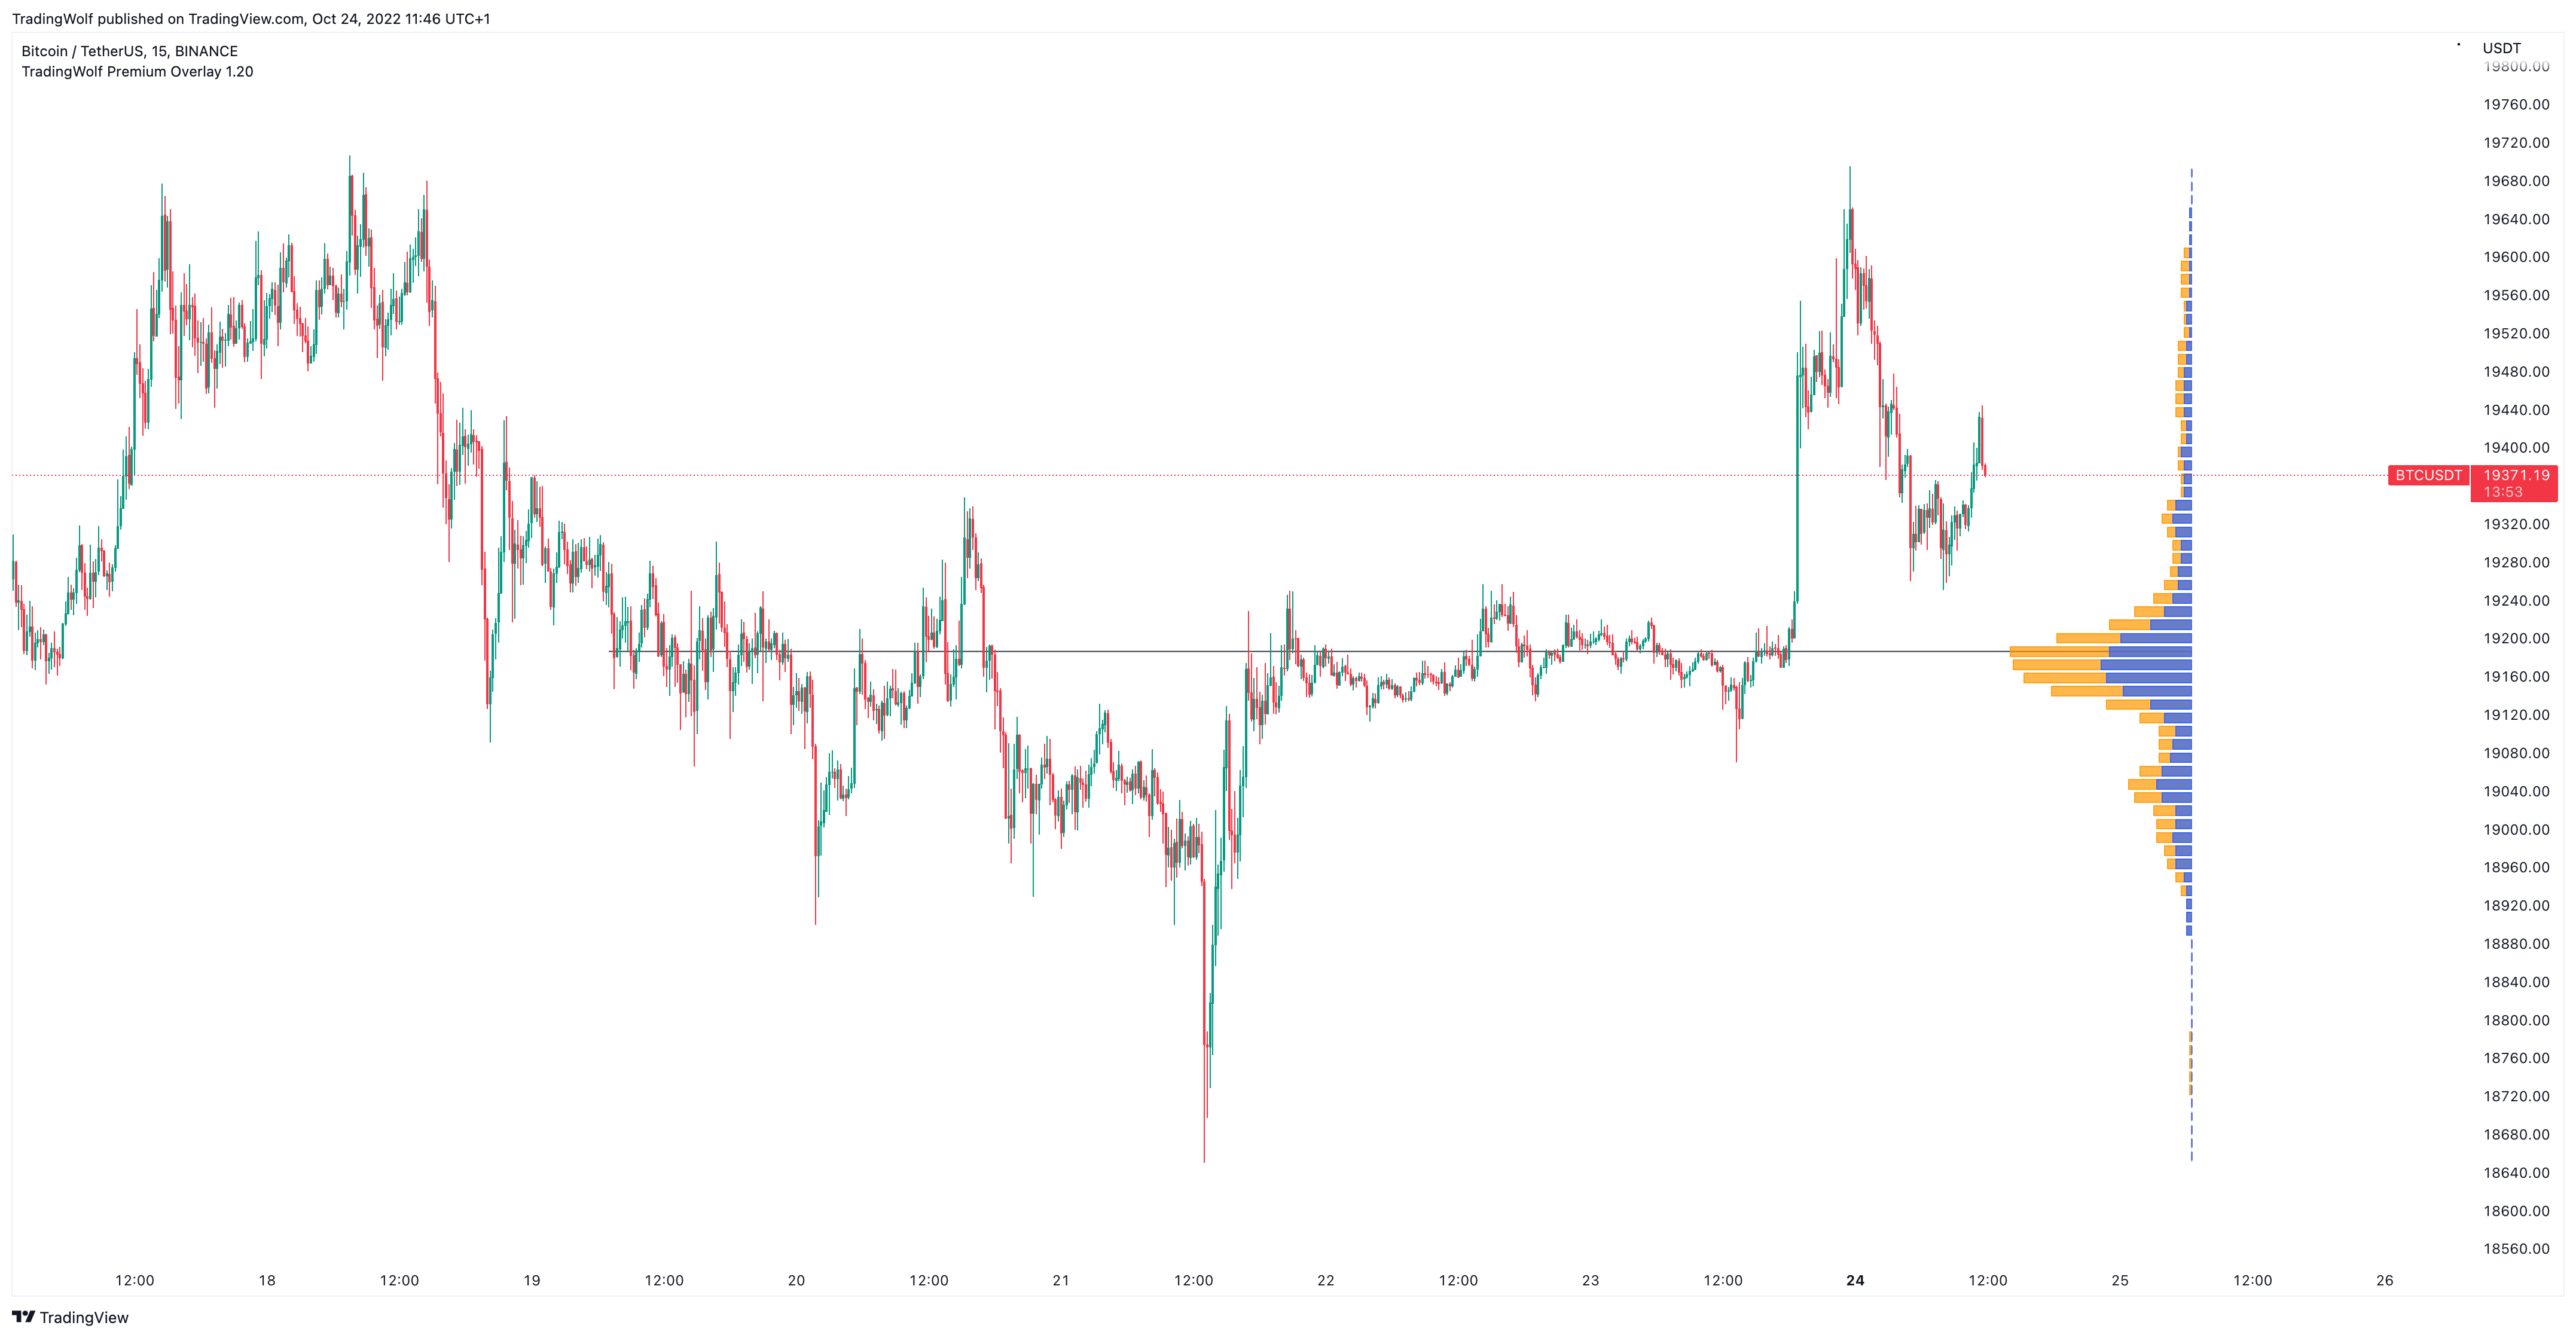
The volume profile is based on price levels, it’s a histogram of the amounts bought and sold at specific price levels. This can adjust on every candle given the data received.
The POC refers to the area in the chart with the most traded volume activity. This is by far the most relevant area you want to monitor as it can help to define the placement of your stops or the areas in the chart where you might find the most pristine entry levels The sensitivity determines how much data the chart should be looking at, 1 is the most sensitive to recent data whilst the max is 5.